How to Read Wind / Temp Aloft Charts

A Wind and Temperature Aloft (FB) Chart shows the forecast wind and temperature at multiple altitude and multiple locations. Pilots and dispatchers can use the FB chart for flight planning, locating potential icing levels and jet streams.
These forecasts are generated 4x daily (00Z, 06Z, 12Z, and 1800Z) by the National Centers for Environmental Prediction (NCEP)
FB charts have a lot of special rules that feels random, however, it is used in order to circumvent the technology limits back the 1940s.
Read current Wind and Temperature Aloft charts through AviationWeather
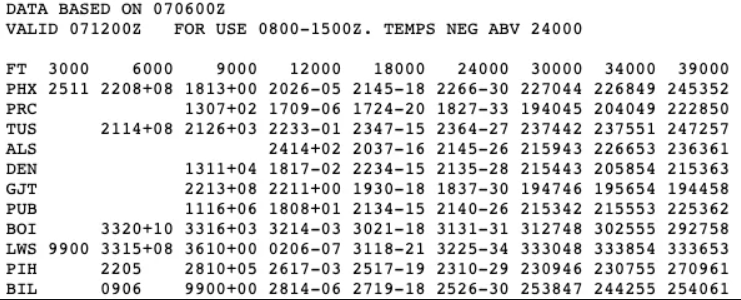
How to read a FB Chart?
We will be focusing on just one airport PLB. FT 3000 , 6000, 9000 - indicates the altitude in MSL (Mean Sea Level).
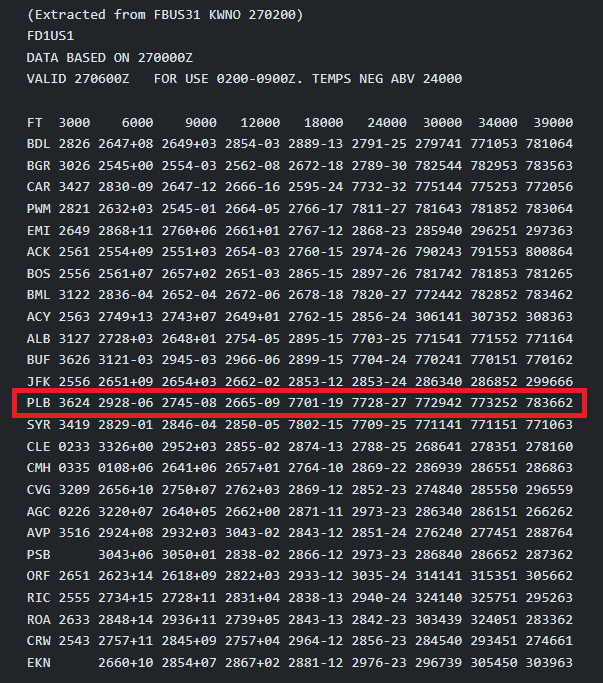
PLB
- 3624 (3000 ft)
- Wind Direction 360 (true north)
- 24 knots
- 2928-06 (6000 ft)
- Wind direction 290
- 28 knots
- -6 degrees Celsius
- 7701-19 (18000 ft)
- Wind direction 77-50 = 270
- 01 + 100 = 101 knots
- -19 degrees Celsius
- If wind direction has anything over 36, you must subtract 50 from the wind direction and add 100 knots to the speed.
- 772942 (30000 ft)
- Wind direction 77-50 = 270
- 29 + 100 = 129 knots
- -42 degrees Celsius
- Anything above 30,000 is assumed negative temperature
Special Rules
Below are are the special rules of a FB Chart:
- There are NO temperature listed for 3000 ft altitude
- If wind direction and speed is listed as 9900, wind is light and variable (speeds less than 5 knots)
- If speed is greater than 199 knots, speed will be listed as 99 (ie. 549945)
- Starting at 30,000 altitude - temperature is assumed to be negative
- Wind direction is rounded to the nearest tenth
- If wind direction has anything over 36, you must subtract 50 from the wind direction and add 100 knots to the speed
We use the -50/+100 rule for any speeds over 100 knots due to the technological limits of the FAA in transmitting more characters in a line.
You should also read:

How to Read All METAR Remarks
Remarks are at the end of a METAR that will explain further details about the current weather at the designated location. They can add further details about tornadoes, winds, visibility, temperature, pressure, etc. Read and understand about METARs before diving into the Remarks. Below is…
Continue reading...How to Read a TAF
A TAF (Terminal Aerodrome Forecast) is a report that is submitted every 6 hours that is valid for 24-30 hours that forecasts the weather for the destination location. It is used by pilots and dispatchers to obtain forecast weather in order to determine if the…
Continue reading...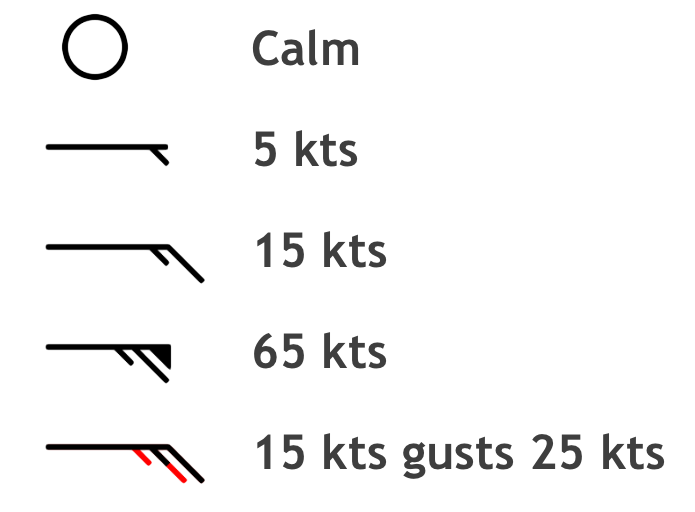
How to Read A Wind Barb
A wind barb is a symbol commonly used in wind graphs, GFAs, and station models. Being able to quickly read a wind barb allows a pilot or dispatcher to quickly gain situational awareness around a windy area. According to the FAA a wind barb is:…
Continue reading...