How to Read SigWx Charts


SigWx Charts (Significant Weather Charts) are forecast charts, provided by the World Area Forecast Centres, that contain turbulence, icing, volcanic ash, thunderstorms, and high winds. These charts are mainly used for flight and en route planning by flight crews.
Check today's SigWx charts here.
SigWx Charts are separated by three altitude levels, and each chart contain different weather information that may be useful for enroute planning. Below is a table that generally explains the three levels.
| Chart Type | Altitude | Contains | Issued |
| Low | SFC - FL240 | freezing levels, turbulence, visibility | 4x a day |
| Mid | 10,000 MSL - FL450 | jet streams, CAT, tropopause heights | 4x a day |
| High | FL250 - FL630 | storms, VA, jet streams, severe turbulence, tropopause | 4x a day |
Table of Contents
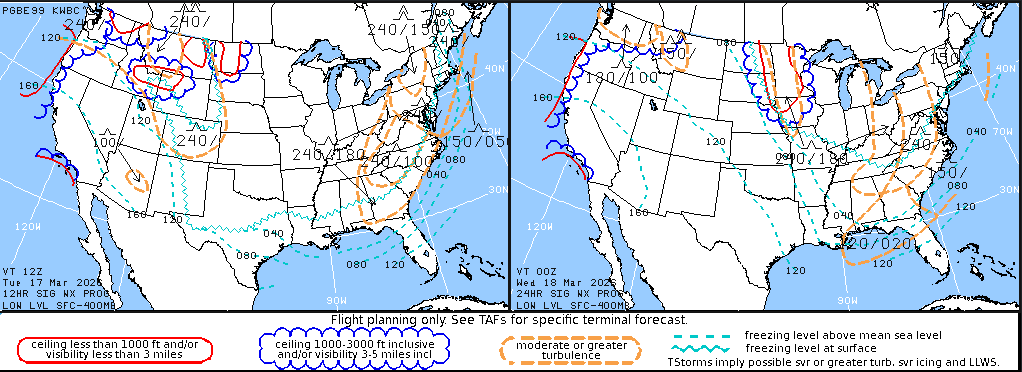
Low Level SigWx
Low Level SigWx charts are pretty simple to read. Simply just follow the legend on the bottom.
Mid Level SigWx
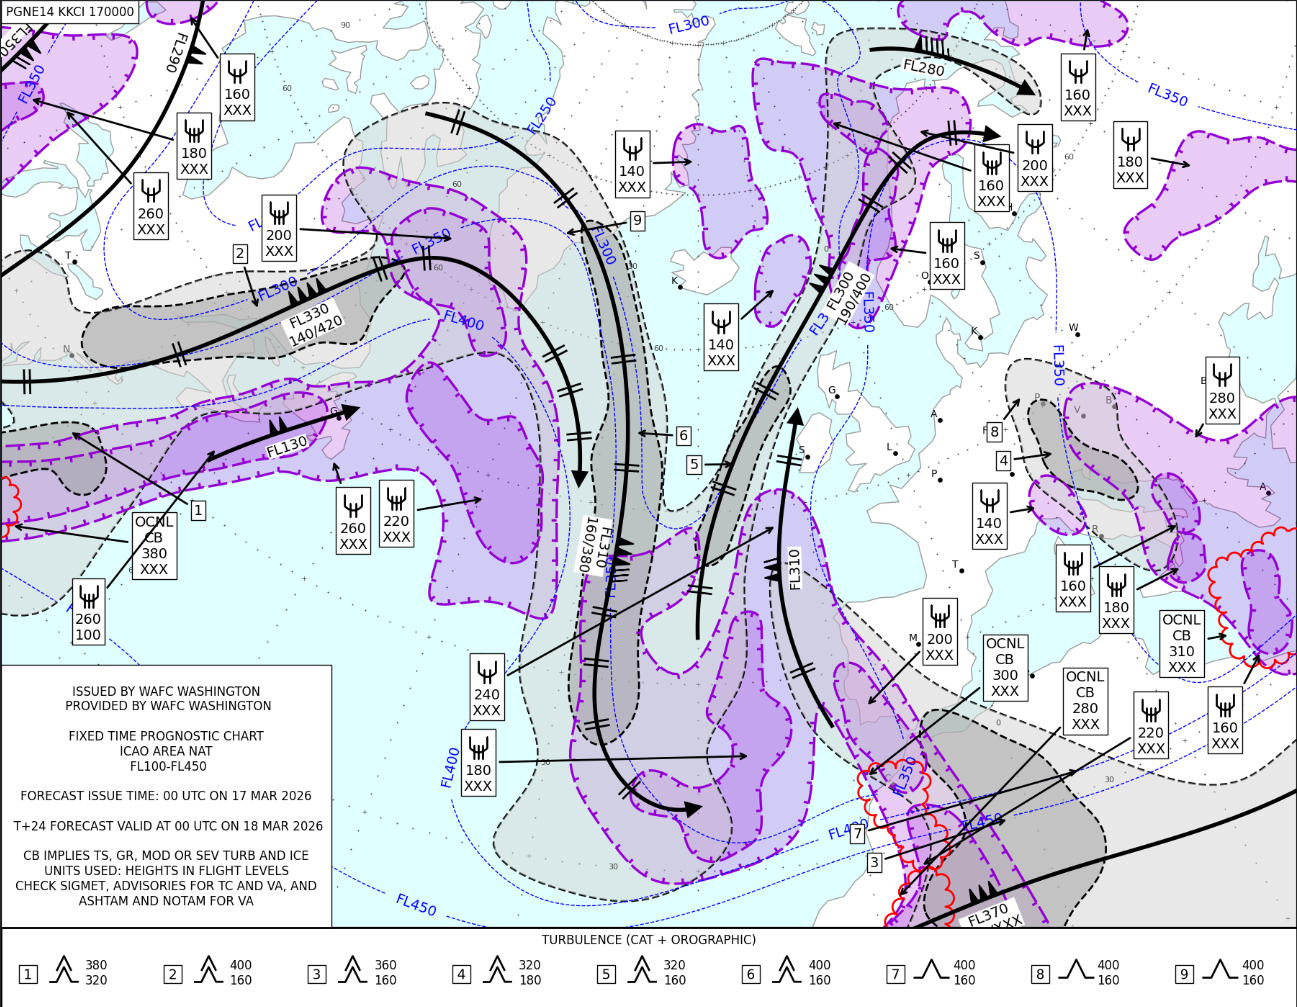
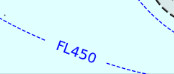
This is the tropopause contour, and the height is at FL450
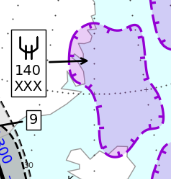
The purple area defines icing. The symbol on the left indicates it is a moderate icing level from FL140 down to an unknown altitude. This means the starting height of the icing level is not inbound with the altitude of the mid level chart. You can usually find the rest of the icing level on the low SigWx Chart.
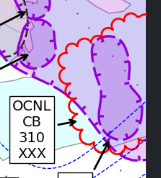
The red clouds area defines cumulonimbus activity. Cumulonimbus activity can be dangerous because of potential thunderstorms, clear air turbulence, and high speed winds. The square on the left say this is an occasional cumulonimbus from FL310 down to an unknown altitude.
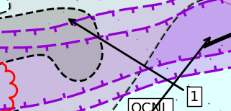
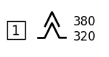
The grey area represents a turbulent area. Usually there will be a number labelled, and you can look below the chart in order to match the area with the symbol. This "1" area is a severe turbulence area from FL320 to FL380.
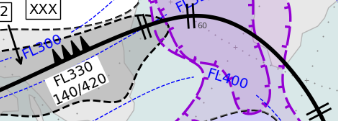

The long band of bold black line indicates the jet stream. The black filled "flags" indicate a speed of 200 knots (50 each), similar to how wind barb works. Under the flags, it indicates that the speed is at FL330, and the entire jet stream starts at FL140 to FL420.
The two bars of lines indicate a change of speed of 20 knots. This is used in order to de-clump the lines.
High Level SigWx
High-level SigWx is mostly the same as a mid level SigWx chart, with an addition to volcanic activity.
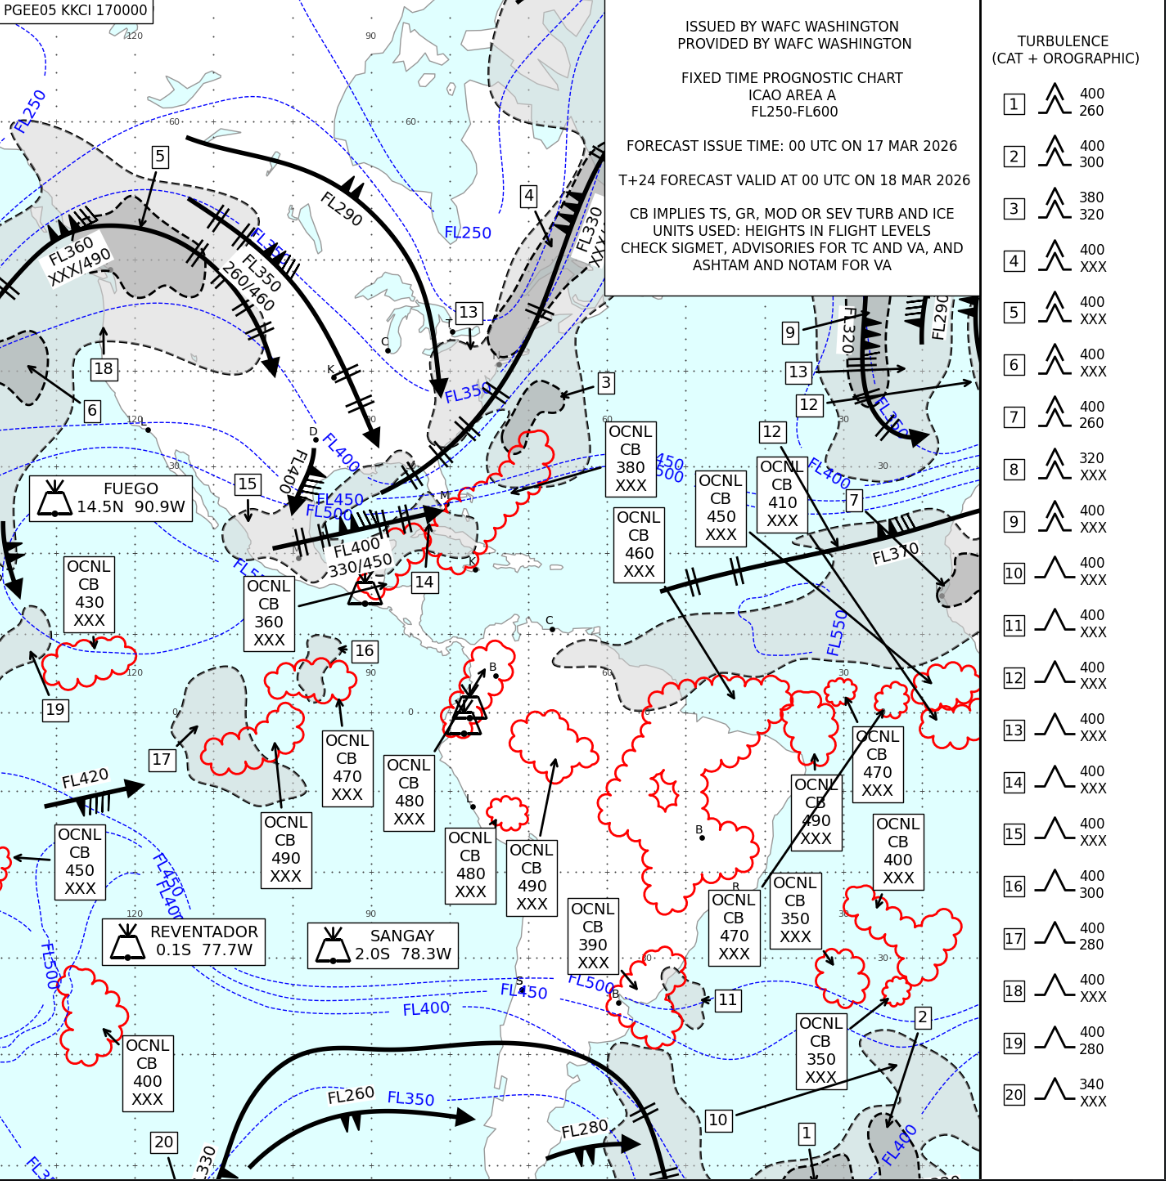
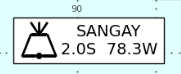
This is the symbol for volcanic activity.
You should also read:
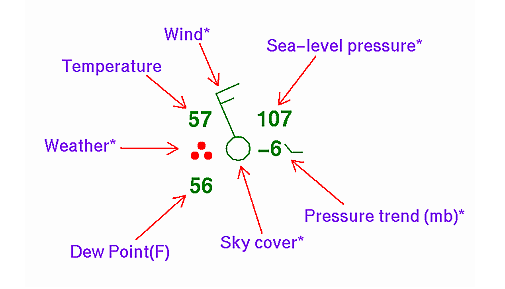
How to Read A Station Model
A station model is a symbol used by meteorological in charts such as the Observation surface weather charts in order to give a quick understanding of surface weather (wind, temperature, sky condition, precipitation, etc) at the designated location. As you can see, a station model…
Continue reading...
How to Read All METAR Remarks
Remarks are at the end of a METAR that will explain further details about the current weather at the designated location. They can add further details about tornadoes, winds, visibility, temperature, pressure, etc. Read and understand about METARs before diving into the Remarks. Below is…
Continue reading...
How to Read A Prog Chart
A prog chart (Surface Analysis Prog Charts) is a forecast chart created by the Weather Prediction Center that provides surface pressure systems, fronts, and precipitation for a multiday period. Each prog chart will forecast a "snapshot" of the weather at the given issued time. The…
Continue reading...