How to Read A Station Model

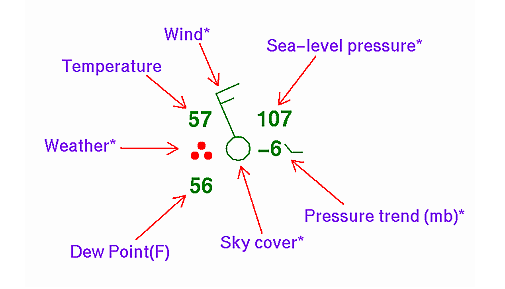
A station model is a symbol used by meteorological in charts such as the Observation surface weather charts in order to give a quick understanding of surface weather (wind, temperature, sky condition, precipitation, etc) at the designated location.
As you can see, a station model is exactly the same parameters as a METAR, therefore, it is important to read this station model in the same order as a METAR. A station model will never give the exact values like a METAR, therefore, it is important to read your METAR if the station model is your destination or alternate airport.
To learn how to read a METAR, click here.
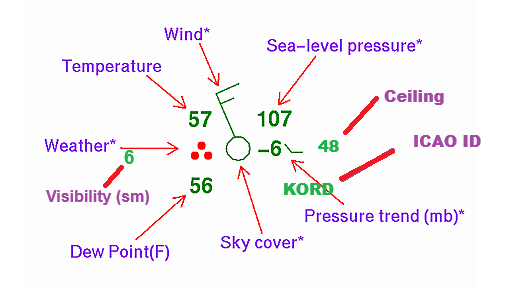
ICAO ID
The first thing to identify is what station the model is reporting this information.
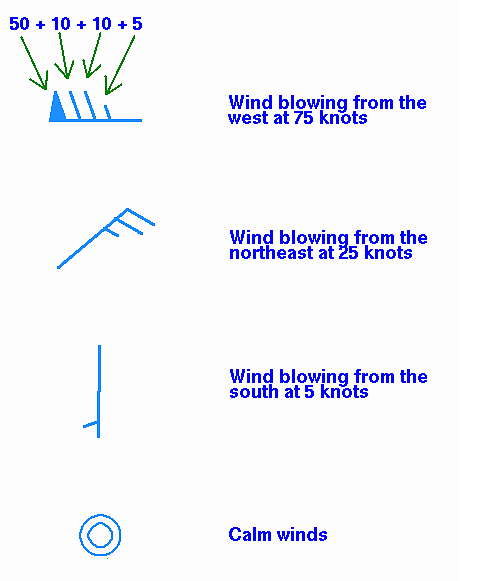
Wind
The first thing we look at is the wind, also known as a wind barb.
Visibility
Then we look at the visibility in statue miles.
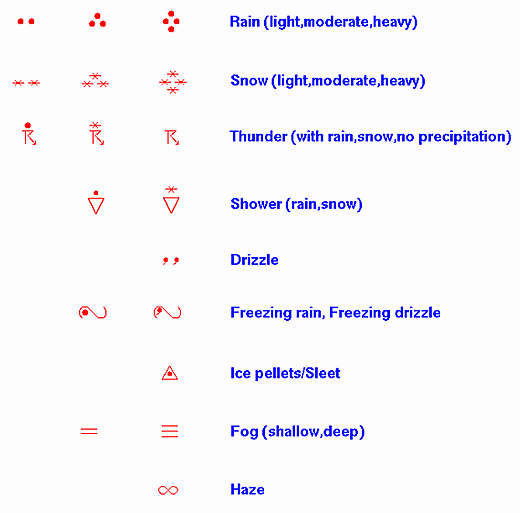
Weather
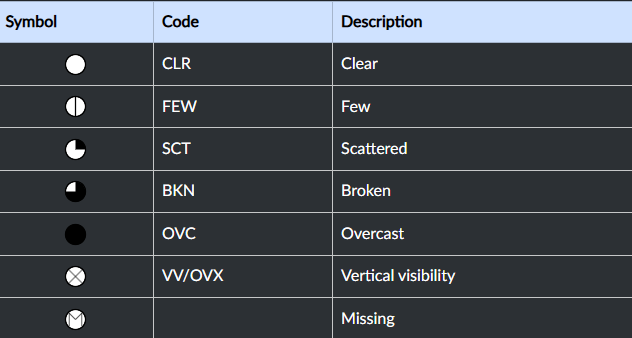
Now we look at the weather symbol. Below is a table of all the weather symbols commonly used in station models.
Sky Cover (Condition)
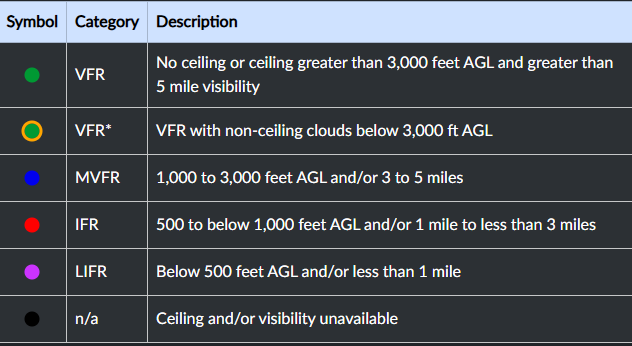
With sky condition, it is common to group the flight category with the sky cover. Below will be the sky cover legend with the flight category legend.
Temperature and Dew-point
Similar to a METAR, the temperature and dew-point are grouped together. In the station model, it is just above and below the weather symbol.
Sea-level Pressure (Altimeter)
The sea-level pressure, or the altimeter, follows the similar rules regardless if its in millibars (mb) or inches of mercury(inHg). It is important to check the chart legend to see which pressure indicators the chart is using.
mb
- Move one decimal to the left
- If the first digit is less than 5, add 10
- If the first digit greater than 5, add 9
inHg
- Move two decimal to the left
- If the first digit is less than 5, add 3
- If the first digit is greater than 5, add 2
Pressure Trend
Pressure trends are usually found in the METAR remarks, but it can sometimes show up in a station model, therefore it is important to know it works. The pressure trend will show a number, indicating a rise or decrease in pressure in tenths of millibars.
Example
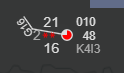
| Type | Value | Explanation |
| ICAO ID | K4I3 | Mount Vernon/Knox County |
| Wind | Wind Barb | Wind is coming from the West, speed ~10 kts, gust 16 knots |
| Visibility | 2 | Visibility 2 statue miles |
| Weather | Weather symbol | light snow |
| Sky Condition | Circle | Broken with IFR conditions |
| Ceiling | 48 | 4800 ft ceiling |
| Temperature / Dew-point | 21/16 | Temperature 21 degrees Fahrenheit, dew-point 16 degrees Fahrenheit |
| Altimeter | 010 | 30.10 inHg |
You should also read:
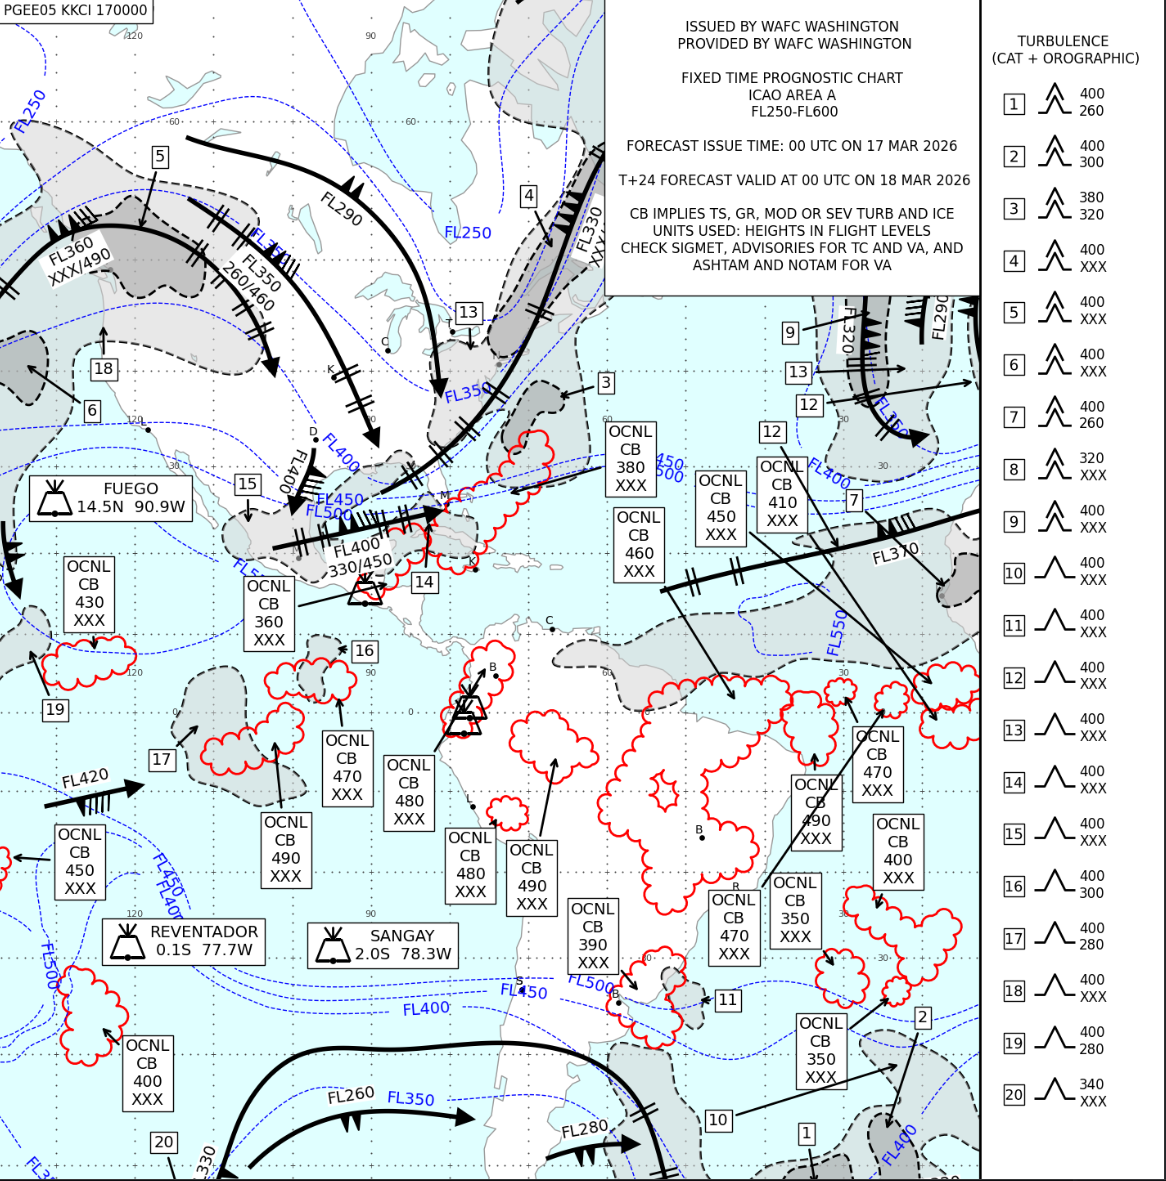
How to Read SigWx Charts
SigWx Charts (Significant Weather Charts) are forecast charts, provided by the World Area Forecast Centres, that contain turbulence, icing, volcanic ash, thunderstorms, and high winds. These charts are mainly used for flight and en route planning by flight crews. Check today's SigWx charts here. SigWx…
Continue reading...
How to Read All METAR Remarks
Remarks are at the end of a METAR that will explain further details about the current weather at the designated location. They can add further details about tornadoes, winds, visibility, temperature, pressure, etc. Read and understand about METARs before diving into the Remarks. Below is…
Continue reading...How to Read a TAF
A TAF (Terminal Aerodrome Forecast) is a report that is submitted every 6 hours that is valid for 24-30 hours that forecasts the weather for the destination location. It is used by pilots and dispatchers to obtain forecast weather in order to determine if the…
Continue reading...