How to Read A Prog Chart


A prog chart (Surface Analysis Prog Charts) is a forecast chart created by the Weather Prediction Center that provides surface pressure systems, fronts, and precipitation for a multiday period.
Each prog chart will forecast a "snapshot" of the weather at the given issued time.

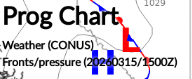
The first thing we check in every chart is, first, are we looking at the correct chart?Second, if the time is valid for our flight.
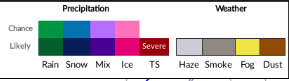
Next, using the legend, we can generally see the precipitation and visibility throughout the map.
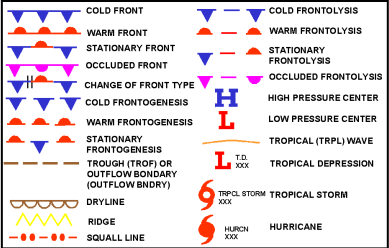
For fronts and pressures, we can use this legend provided the FAA.
Learn more about weather fronts here.

The grey numbers corresponds with the lines across the screen. The lines are called isobars, which are lines of equal atmospheric pressure. The closer the lines are, the stronger the wind. The picture above have lines that are close to each-other, therefore, you will see stronger winds here.
You should also read:
How to Read a TAF
A TAF (Terminal Aerodrome Forecast) is a report that is submitted every 6 hours that is valid for 24-30 hours that forecasts the weather for the destination location. It is used by pilots and dispatchers to obtain forecast weather in order to determine if the…
Continue reading...
How to Read All METAR Remarks
Remarks are at the end of a METAR that will explain further details about the current weather at the designated location. They can add further details about tornadoes, winds, visibility, temperature, pressure, etc. Read and understand about METARs before diving into the Remarks. Below is…
Continue reading...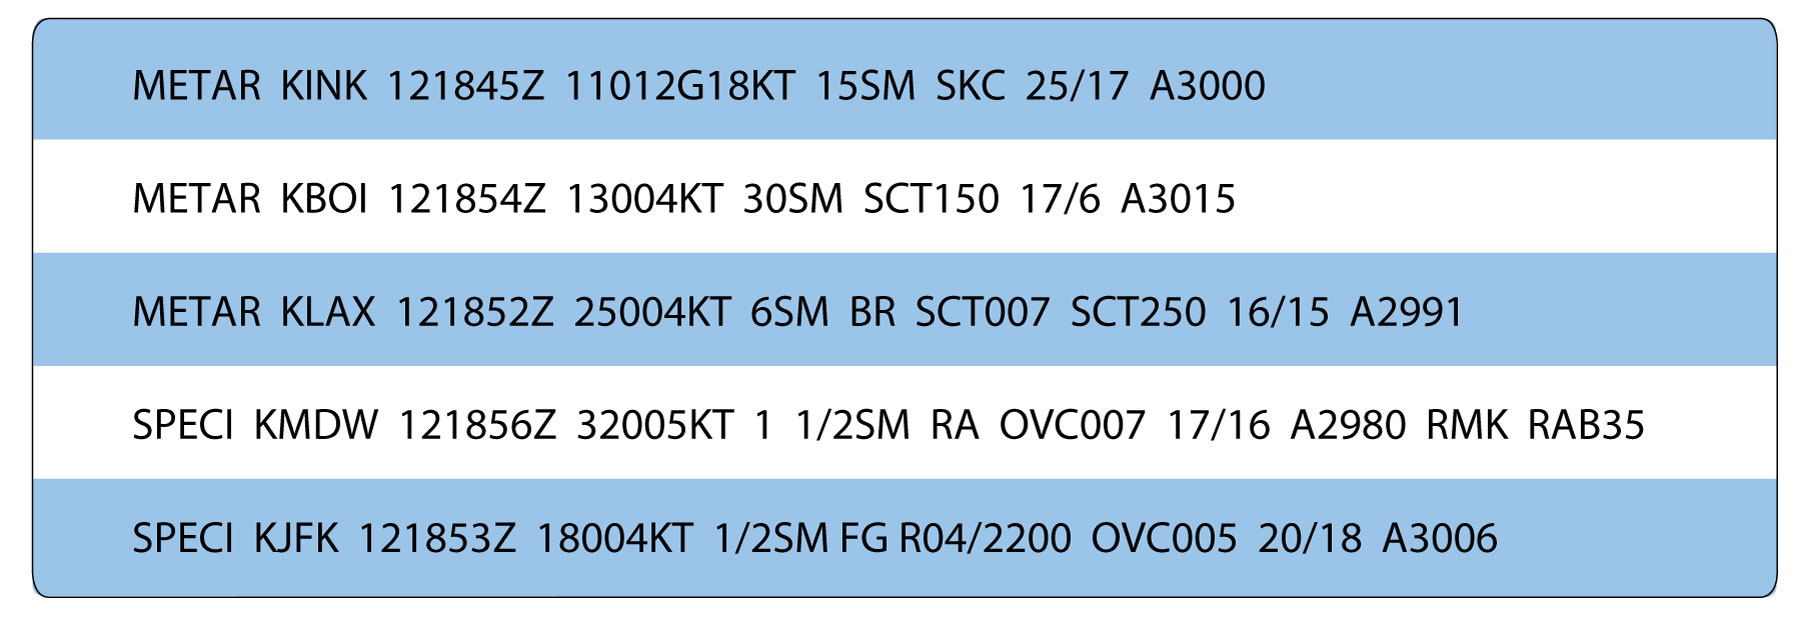
How to Read a METAR
METAR (METeorological Aerodrome Report) are issued every hour at each reporting locations that reports the current weather valid for 1 hour. METARs are used by pilots, dispatchers, and ATC to obtain current weather information at the location. Check out your local's airport METAR by entering…
Continue reading...